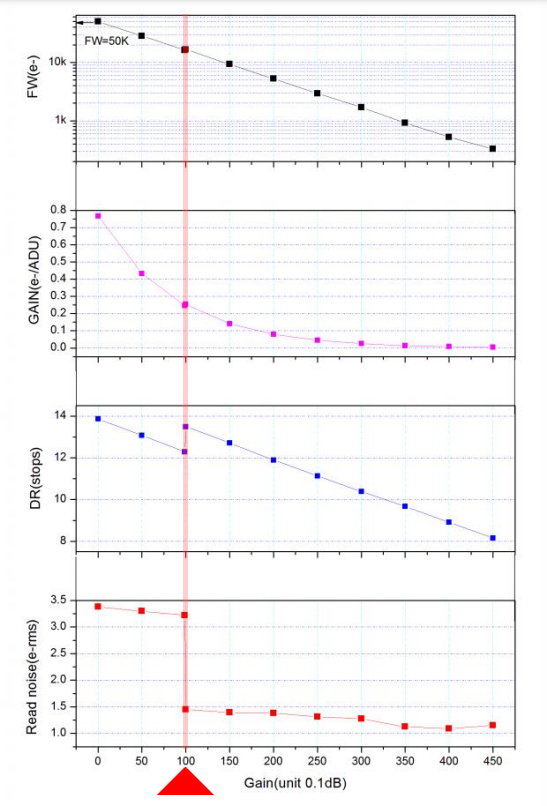
ZWO provides a multifaceted chart that can be used to assess a camera's performance. The chart can be confusing or intimidating at first, but we are here to help explain things.
The chart can be viewed as a linked series of charts that show specifications of any given Gain setting. The four panel chart is a sliding scale, a balancing act, if you will. These charts are all associated with a gain setting that you will set in your imaging software. For example, to see how a camera performs at a gain of 100, locate that value at the bottom of the chart and follow it up through each subsequent chart to assess the performance of the camera at that specific setting. What can be seen as this exercise is repeated across the range of gain values, is that the camera can not be operated in a setting that offers the lowest read noise, highest dynamic range, and largest full well simultaneously. This is why learning how to read these charts is so important; not only will it better help when comparing cameras, but also help to select the gain setting that best suits your goals, with whichever camera you end up with.
 Click to Enlarge Image
 Click to Enlarge Image
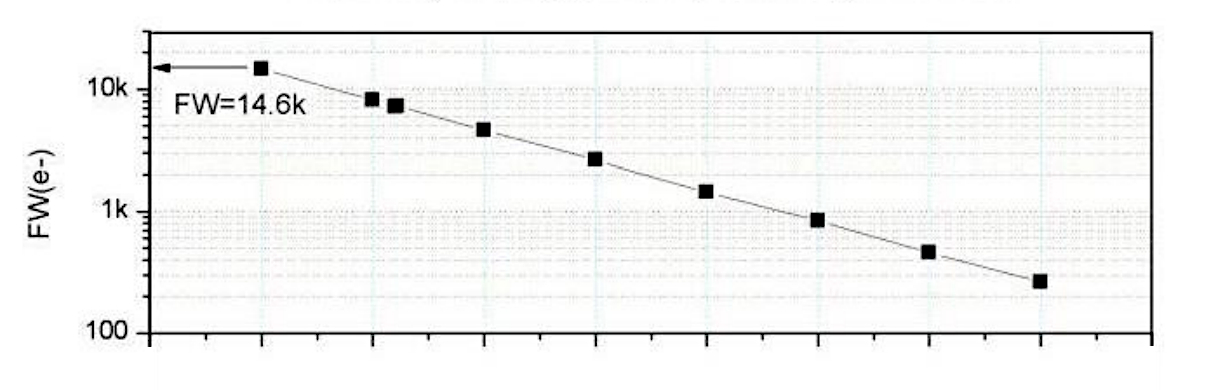
On the first part of the chart it shows the Full Well depth. In a simplified explanation, full well is the amount of signal that the camera can store for each pixel before you hit the maximum level and additional signal will no longer be registered for each exposure. If you think of it in terms of a bucket of water, this setting would represent the volume of the bucket; how much signal each pixel can hold before you have to dump the whole sensor out (read the image) and take a new exposure. In order to obtain the largest full well depth, we can follow the series of charts down to the bottom and see that this large full well is available at the lowest gain setting. Similar can be said for all subsequent portions of the chart; locate a specific value that you desire and follow that to the bottom of the chart to see what gain setting offers this performance.
 Click to Enlarge Image
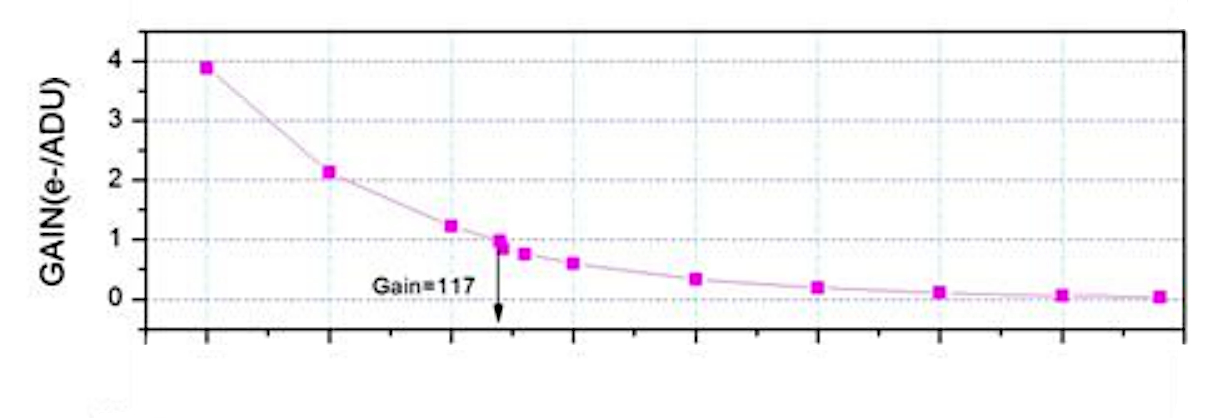
Gain e-/ADU is a complex concept to think about but a brief description is as follows: In digital cameras, the circuitry converts the analog light signal that reaches each pixel and the sensor as a whole, into a digital numerical electrical value that can be stored as an image file. If you’ve ever looked at the pixel values of an astro photo, you might have noticed that it had an ADU numerical value. ADU stands for Analogue to Digital Unit. Gain is the representation of how many light photons that are stored within that well, or bucket, that we just spoke about with “Full Well.”
 Click to Enlarge Image
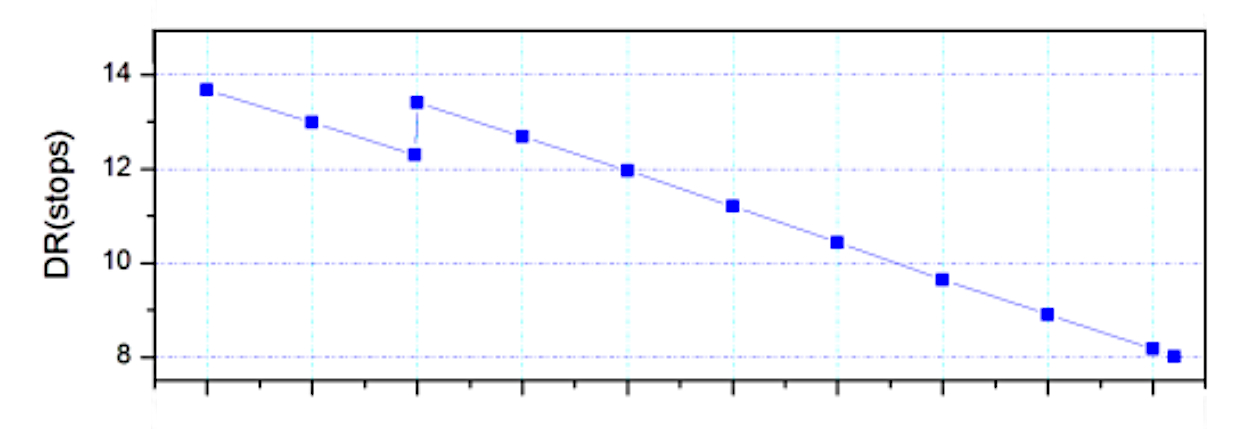
Dynamic range can be thought of as the number of shades available in a box of crayons. Do you have an 8 pack, 16 pack, or 32 pack of crayons? All of these different counts will allow you to draw a picture, but the larger packages offer more shades of each color to choose from and the more dynamic your image can be. This can make for a smoother and higher quality image.
 Click to Enlarge Image
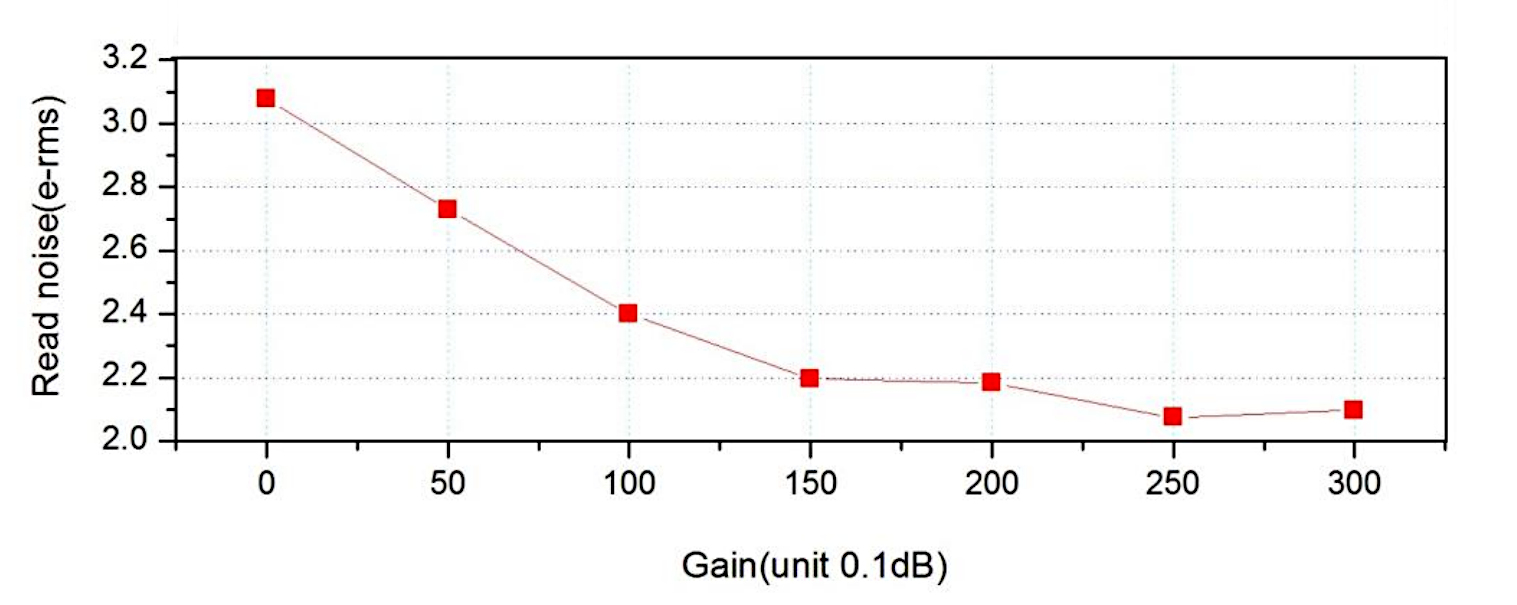
Read Noise is the amount of noise within the conversion of the analog photon levels, as they are converted into a digital signal (ADU) that is used to create the image on a digital camera. The lower the read noise, the cleaner the image, and the higher the signal to noise ratio. The higher the signal to noise ratio, the better. However, we must still consider all of the previously mentioned parameters as well.
Most users find that they want to imagine a gain setting which offers the best balance of all parameters. The goal being the lowest read noise, highest dynamic range, and largest full well. This is typically around a 100 gain setting on many ZWO cameras. Take a look at the charts and see for yourself.
Dark Current
 Click to Enlarge Image
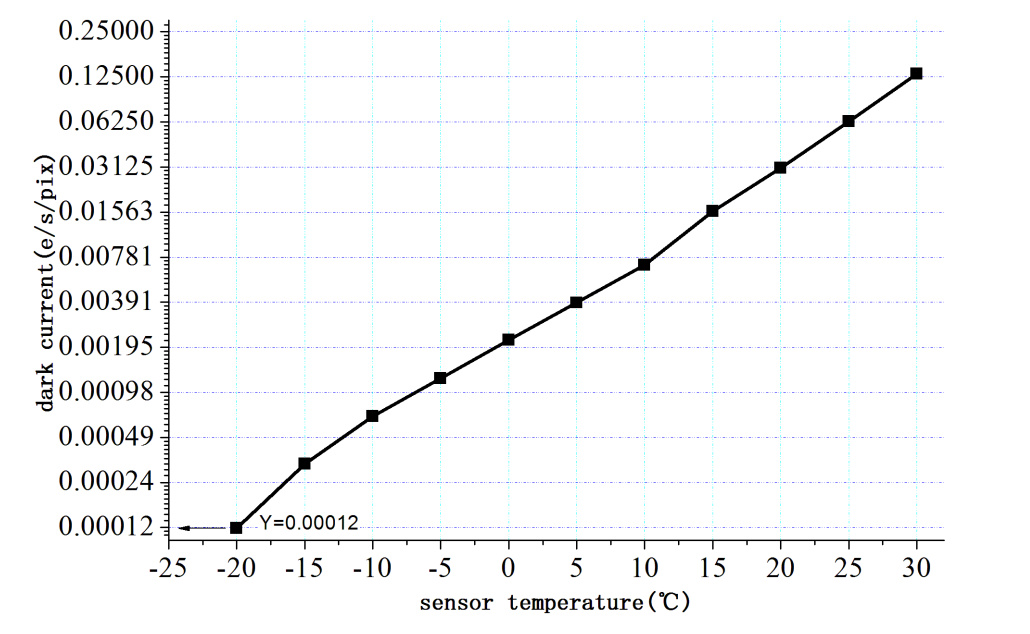
Dark current is noise that happens to muddy the image as the exposure happens. Unlike read noise, which happens just at the end of the exposure, this dark current is happening throughout the exposure. So, the lower the dark current, the cleaner the image can be when compared to a camera with a higher dark current. Remember all of the other parameters though as a balanced combination of all parameters is what generally makes for a great camera, not just one specific attribute.
Quantum Efficiency
 Click to Enlarge Image
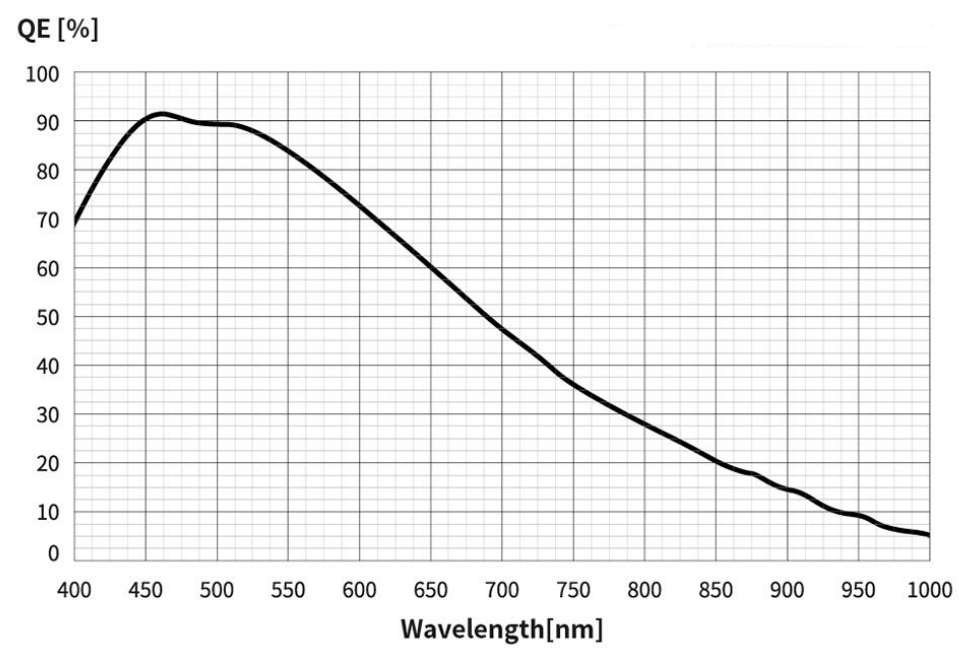
Quantum Efficiency (QE) describes the percentage of signal which reaches the camera’s pixels from your telescope, that is converted into a usable signal stored in the image file. Old DSLR cameras and CCD cameras had a QE in the range of 50%. Meaning only about half of the light from the telescope was converted into a usable signal. More modern cameras can have EQ ratings at some wavelengths as high as 90% or more. The more light that is converted to signal(QE) the higher the signal to noise ratio in the image, the better the image.
 Click to Enlarge Image
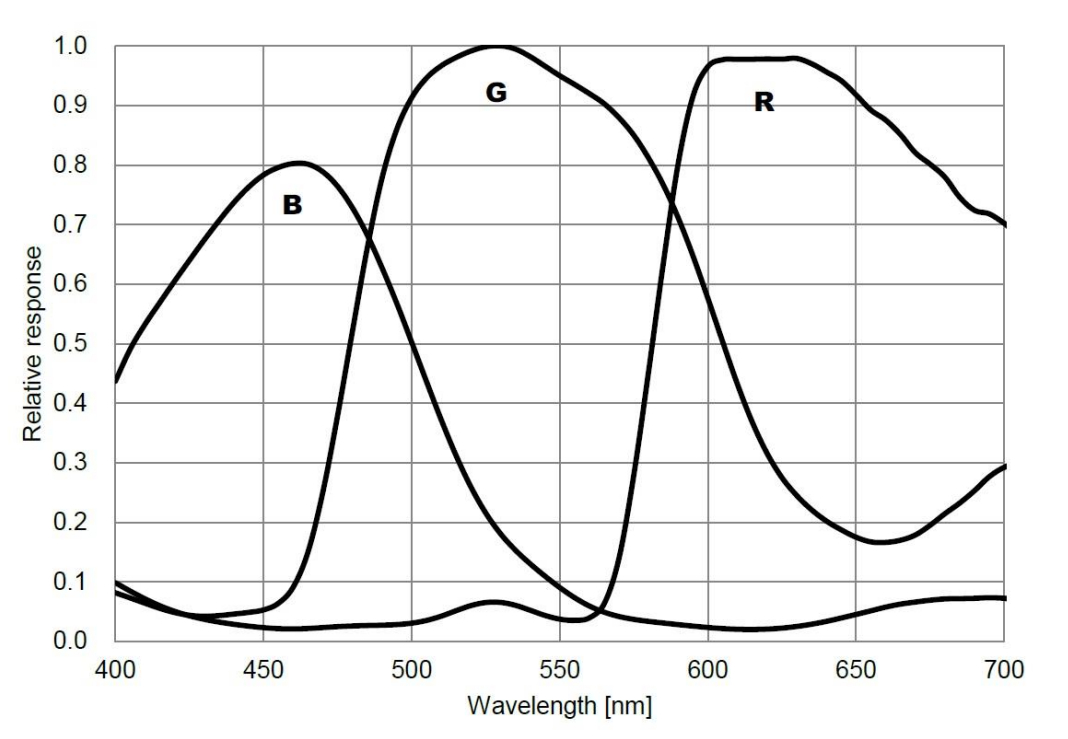
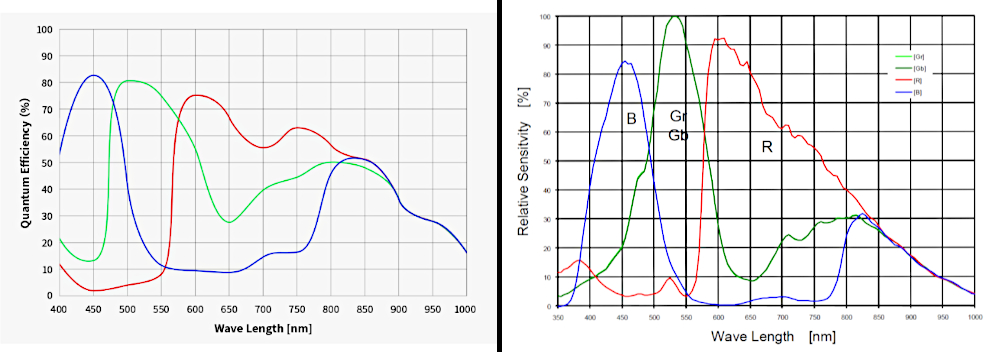
Some manufacturers list QE charts for their cameras. These charts show that the efficiency differs across the visible spectrum. They are usually more sensitive in the green range and less sensitive in the blue and red colors. Some of these charts are given as a relative number, and some list it as an actual QE number. It is important to take note of this when making direct comparisons of one camera’s QE chart to another’s.
 Click to Enlarge Image